Histograms
Histograms are graphs that display the distribution of tones and colors in the scanned image. Dark tones are indicated at the left end of the x-axis of the graph, light tones at the right end, and midtones are in the middle.
There are four different histogram graphs available in VueScan and these can be displayed in the Options panel by selecting one of the Image | Graph … options from the Image menu.
Here’s a description of what each one does:
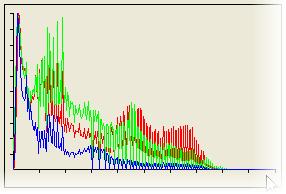
-
Graph raw: displays the tone and color histogram from before any adjustments have been made
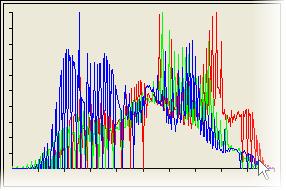
-
Graph image: displays the tone and color histogram after you have made adjustments using the two graphs below…
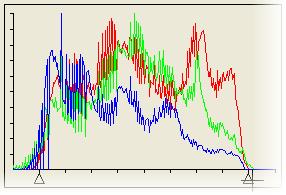
-
Graph b/w: allows you to set the black point and white point thresholds. This works in a similar way as the levels tool in image editors such as Photoshop(TM). Drag the arrows at the base of the graph to make adjustments
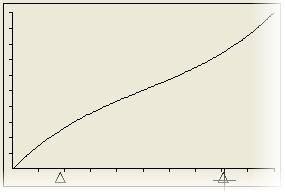
-
Graph curve: similar to the Curves tool in image editors such as Photoshop(TM), this allows you to fine tune highlights, midtones and shadows. Drag the arrows at the base of the graph to make adjustments